Open the teaching deck, worksheet, and editable slide source.
Interactive Lab
Practice in short loops: checkpoint quiz, microtask decision, and competency progress tracking.
Checkpoint Quiz
Ultrastructure Interpretation Microtask
Best response to an ambiguous ultrastructure cue?
Progress Tracker
State is saved locally in your browser for this module.
0% complete
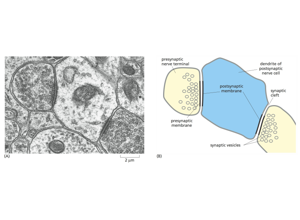
Ultrastructure Feature Annotation
Select the hotspot most consistent with synaptic ultrastructure evidence.
Selected hotspot: none
Capability target
Evaluate EM image patches for artifact risk and issue a justified pass/rework recommendation.
Concept set
Image quality as a scientific constraint
EM image quality is not merely an aesthetic concern — it is the single most consequential variable that determines segmentation accuracy and, by extension, the validity of every connectomic claim built on that segmentation. A 20% reduction in membrane contrast can double the split error rate in automated reconstruction, because the segmentation model loses the luminance gradient it relies on to delineate adjacent neurites. Every downstream analysis result — synapse counts, path lengths, circuit motifs — inherits the quality ceiling set at acquisition. This means that the person evaluating image quality is making a decision that propagates through the entire pipeline. Treating QA as a clerical step rather than a scientific judgment is one of the most common and costly mistakes in connectomics projects.
Students should internalize a core principle: you cannot proofread your way out of a bad image. While proofreading can correct segmentation errors one at a time, systematically degraded images produce error rates that overwhelm any realistic proofreading budget. The goal at acquisition is to produce images where automated segmentation succeeds on the vast majority of the volume, leaving proofreaders to handle only the genuinely ambiguous cases.
Artifact taxonomy linked to downstream error
Each major EM artifact maps to a specific class of segmentation failure. Understanding this mapping is essential for making rational QA decisions:
Knife chatter (periodic scratches from ultramicrotome blade imperfections) creates false splits by introducing bright linear artifacts that the segmentation model interprets as membranes.
Charging artifacts (localized brightness shifts from electrostatic charge accumulation) produce false splits at low-contrast boundaries where the charging gradient masks the true membrane signal.
Tissue folds introduce non-recoverable topology gaps — the folded region contains overlapping tissue that cannot be computationally unfolded, creating a permanent hole in the reconstruction.
Missing sections (lost or damaged serial sections) cause neurite breaks proportional to the number of consecutive sections lost. A single missing section is often recoverable; three or more consecutive missing sections will sever most neurites passing through that plane.
Staining gradients (uneven heavy metal penetration across the block face) produce spatially varying error rates, meaning that segmentation quality differs across the field of view in ways that are difficult to detect without systematic sampling.
A detailed reference for each artifact type, including representative images and mitigation strategies, is available in the content library entry on artifact taxonomy. Students should consult this resource before and after the studio activity.
QA gates and escalation logic
Not all imaging quality issues require re-acquisition. The concept of go/no-go checkpoints provides a structured framework for deciding when to stop imaging and fix a problem versus when to proceed and manage the issue downstream. The key insight is cost asymmetry: fixing a staining problem at the acquisition stage costs days, but the same problem discovered at the proofreading stage costs weeks of manual correction spread across dozens of proofreaders.
QA gates should be defined at three levels:
Hard stop — artifacts that make reconstruction impossible (severe folds, large-area charging, gross contamination). These require immediate re-acquisition or block re-trimming.
Flag and monitor — artifacts that degrade quality but remain within the tolerance of current segmentation models (mild knife chatter, minor staining gradients). These are logged, and the affected regions are prioritized for proofreading.
Pass — the image meets all quality thresholds for the target resolution and analysis goals.
Escalation logic should also specify who makes the call at each level. A trainee can pass or flag; only the imaging lead should authorize a hard stop and re-acquisition, because the cost of that decision is significant.
EM modalities for connectomics
Three primary EM modalities are used in modern connectomics, each with distinct tradeoffs in resolution, throughput, and artifact profiles:
Serial-section TEM (ssTEM): Ultrathin sections (~30-50 nm) are collected on tape or grids and imaged in a transmission electron microscope. Typical resolution: ~4 nm XY, ~30 nm Z (set by section thickness). High XY resolution enables confident synapse identification, but the large Z step means small neurites can be lost between sections. Artifacts include section folds, knife chatter, and staining variability between sections.
Serial block-face SEM (SBEM): A diamond knife inside the SEM chamber removes thin layers from the block face, which is imaged after each cut. Typical resolution: ~8 nm XY, ~25 nm Z. Automated and capable of imaging large volumes (>1 mm^3), but lower XY resolution can make small synapses ambiguous. Artifacts include knife chatter, charging, and surface debris.
Focused ion beam SEM (FIB-SEM): A gallium ion beam mills ~4-8 nm layers from the block face. Typical resolution: ~4 nm isotropic (XY = Z). The isotropic voxels simplify 3D segmentation and enable tracing of even the finest neurites, but throughput is low and volumes are typically limited to tens of micrometers per side. Artifacts include curtaining (ion beam striping) and re-deposition.
The choice of modality depends on the scientific question. Large-scale circuit mapping (e.g., MICrONS) uses SBEM or ssTEM for throughput; ultrastructural studies of specific synaptic features may favor FIB-SEM for its isotropic resolution.
Core workflow
Inspect image quality and artifact signatures.
Classify severity and likely impact on segmentation.
Decide pass/flag/rework with documented rationale.
Log findings in a structured QA record for reproducibility.
60-minute tutorial run-of-show
Pre-class preparation (5-10 min async)
Before the session, students should:
Review the EM principles content library entry, focusing on the section on image formation and contrast mechanisms.
Preview the three sample image patches posted to the course portal: one clean image, one with moderate knife chatter, and one with a tissue fold. For each, note initial impressions of quality.
Materials needed
Projected EM image gallery (8-10 patches at varying quality levels)
Printed or digital QA decision worksheet (one per student)
Instructor cue: “We are going to start with a fast review. I will show four images — tell me which modality produced each one and why you think so.”
Show four images (ssTEM, SBEM, FIB-SEM, and one intentionally ambiguous). Cold-call students for modality identification and reasoning.
Briefly review how contrast arises from heavy metal staining and electron scattering. Emphasize that membrane visibility depends on staining protocol, not microscope settings alone.
2. 08:00-20:00 — Artifact recognition walkthrough
Instructor cue: “Now I am going to show you the five artifacts that cause 90% of segmentation failures. For each one, I want you to predict: will this cause a merge error, a split error, or a topology break?”
Walk through knife chatter, charging, folds, missing sections, and staining gradients with annotated example images.
For each artifact, show the segmentation output on the same region so students can see the predicted error type realized in practice.
Formative check: After the third artifact, pause and ask students to classify the next one independently before revealing the answer.
3. 20:00-34:00 — Learner triage round
Instructor cue: “You have 14 minutes. Work in pairs. Each pair receives six image patches. For each patch, fill in the QA worksheet: artifact type, severity (1-3), predicted segmentation impact, and your pass/flag/rework decision.”
Circulate and listen for common misconceptions. Note which artifact types cause the most disagreement.
Formative check: At 30:00, ask one pair to share their most difficult call and explain their reasoning.
4. 34:00-46:00 — QA threshold debate
Instructor cue: “Pair A said this patch is a pass. Pair B said rework. Both of you, defend your position.”
Facilitate structured debate on 2-3 patches where pairs disagreed. Push students to articulate the cost tradeoff: what is the cost of re-acquiring versus the cost of proofreading the resulting errors?
Introduce the concept of escalation levels (hard stop, flag and monitor, pass) and ask students to re-classify their six patches using this framework.
5. 46:00-56:00 — Decision logging practice
Instructor cue: “A QA decision that is not logged does not exist. You are now going to write a QA log entry for your hardest patch.”
Students write a structured QA entry: image ID, artifact type, severity, decision, rationale, and any conditions (e.g., “pass if proofreading budget is allocated to rows 12-18”).
Show an example of a well-written and a poorly-written QA entry for comparison.
6. 56:00-60:00 — Competency check
Instructor cue: “Final check. I am showing one new patch. You have two minutes to write your QA verdict on an index card. Include artifact type, severity, decision, and one sentence of rationale.”
Collect index cards. Review after class to identify students who need follow-up.
Formative assessment checkpoints
08:00: Can students distinguish EM modalities from image appearance?
20:00: Can students predict segmentation error type from artifact type?
34:00: Can students apply severity ratings consistently across patches?
46:00: Can students articulate cost tradeoffs in QA decisions?
56:00: Can students write a structured QA log entry?
Post-class assignment
Select three EM image patches from the course dataset that were not covered in class. For each patch, write a complete QA log entry (artifact type, severity, predicted segmentation impact, pass/flag/rework decision, rationale). Submit as a single document. At least one patch should involve an artifact type the student finds personally difficult to assess — include a brief reflection on what makes it challenging.
Studio activity
Scenario
Your team has received pilot images from a new ssTEM acquisition of mouse visual cortex. The imaging facility reports that initial sections looked good, but they encountered intermittent knife chatter starting around section 200 and a possible staining gradient in the lateral third of the field of view. Before the facility commits to imaging the remaining 800 sections, your team must evaluate the pilot data and deliver a go/no-go recommendation with conditions.
Task sequence
Step 1 — Survey (10 min): Open the six provided image patches (three from the clean region, three from the reported problem areas). For each patch, independently record: modality confirmation, visible artifacts, and an initial severity impression.
Step 2 — Artifact classification (15 min): Using the artifact reference card, formally classify each artifact by type and assign a severity score (1 = minor, cosmetic; 2 = moderate, segmentation-affecting; 3 = severe, reconstruction-blocking). Map each artifact to its expected segmentation consequence (merge, split, or topology break).
Step 3 — Spatial pattern analysis (10 min): Arrange the patches by their spatial position in the volume. Determine whether the artifacts are spatially correlated (e.g., staining gradient affecting one side consistently) or random. Spatially correlated artifacts require different mitigation than random ones.
Step 4 — Cost-benefit analysis (10 min): For each artifact, estimate the downstream cost if the facility proceeds without fixing it. Consider: how many proofreading hours per affected section? How many sections are likely affected? Compare this to the cost of pausing acquisition for knife replacement or re-staining.
Step 5 — Recommendation memo (15 min): Write a one-page memo to the imaging facility with your team’s recommendation. The memo must include: (a) a summary table of artifacts found, (b) your go/no-go decision with conditions, (c) specific remediation steps if you recommend pausing, and (d) a monitoring plan if you recommend proceeding.
Expected outputs
Completed QA worksheet for all six patches
Spatial artifact map (annotated sketch or diagram)
One-page recommendation memo with summary table
Time estimate
Approximately 60 minutes for the full activity. Steps 1-2 can be done individually; Steps 3-5 should be done as a team of 3-4 students.
Assessment rubric
Minimum (pass): Accurate identification of major artifacts across all patches, correct mapping to segmentation error type, and a defensible pass/flag/rework decision for each patch.
Strong (merit): Clear articulation of cost tradeoffs, consistent severity thresholds across patches, spatially aware analysis, and a well-structured recommendation memo with specific conditions.
Failure: Artifact labels assigned without reference to downstream segmentation implications, or QA decisions made without documented rationale.
Pick one artifact and explain how it could create a merge or split error later. Then estimate: if this artifact appears on 5% of sections, how many additional proofreading hours would it add to a 1000-section volume?
References
Briggman, K. L., & Bock, D. D. (2012). Volume electron microscopy for neuronal circuit reconstruction. Current Opinion in Neurobiology, 22(1), 154-161.
Denk, W., & Horstmann, H. (2004). Serial block-face scanning electron microscopy to reconstruct three-dimensional tissue nanostructure. PLoS Biology, 2(11), e329.
Hua, Y., Laserstein, P., & Bhatt, D. K. (2015). A simplified method for high-contrast en bloc staining of large tissue volumes using reduced osmium thiocarbohydrazide-osmium (rOTO). Journal of Neuroscience Methods, 242, 26-32.
Peters, A., Palay, S. L., & Webster, H. deF. (1991). The Fine Structure of the Nervous System: Neurons and Their Supporting Cells (3rd ed.). Oxford University Press.
Hayworth, K. J., Morgan, J. L., Schalek, R., Berger, D. R., Hildebrand, D. G. C., & Lichtman, J. W. (2014). Imaging ATUM ultrathin section libraries with WaferMapper: A multi-scale approach to EM reconstruction of neural circuits. Frontiers in Neural Circuits, 8, 68.
Teaching Materials
Slide Deck
Classroom-ready deck links for teaching and delivery.