

Error Taxonomy in Connectome Proofreading
Instructor Notes
This document is a standalone instructor script. It provides the full narrative, real references, worked examples, and a misconceptions table. Adapt the depth and pacing to your audience; the material here is intentionally detailed so that nothing needs to be improvised.
1. Why Errors Matter
1.1 The Scale Problem
Modern automated segmentation pipelines have reached impressive accuracy. Lee et al. (2019) demonstrated flood-filling networks that achieve “superhuman” voxel-level accuracy on benchmark datasets. Yet even a per-edge error rate of 1-5 % becomes catastrophic at connectome scale.
Key calculation to present on the board:
Consider a neuron whose arbor passes through 1,000 supervoxel-to-supervoxel edges in the segmentation graph. If each edge has a 1 % probability of being wrong, the probability that the neuron is completely error-free is:
P(no error) = (1 - 0.01)^1000 = 0.99^1000 approx 0.000043
That is a 99.996 % chance of at least one error somewhere along the neuron. Even at 0.1 % per-edge error rate the probability of a fully correct neuron with 1,000 edges is only about 37 %.
Instructor tip: Walk students through this calculation live. It is the single most effective way to motivate why proofreading exists as a field.
1.2 Errors Are Not Equally Harmful
A boundary that is shifted by two voxels matters much less than a merge that fuses two excitatory neurons into one. The taxonomy below is ordered roughly by frequency (most common first), but the hierarchy of downstream impact is: merge errors > split errors > boundary errors > identity errors in terms of how often each type corrupts a connectome analysis.
2. Merge Errors
2.1 Definition
A merge error occurs when two or more distinct neurons are incorrectly joined into a single segment by the automated pipeline. In the supervoxel graph representation, this means there is at least one false edge linking supervoxels that belong to different ground-truth neurons.
2.2 Causes
| Cause | Mechanism | Typical context |
|---|---|---|
| Close membrane apposition | Two membranes approach within < 20 nm, falling below the model’s resolution limit | Parallel axons in dense neuropil |
| Low staining contrast | Membrane signal drops, model cannot distinguish boundary | Poor fixation regions, section edges |
| Blood vessel boundaries | Vessel endothelium creates a false membrane-like boundary that “bridges” two neurites | Capillaries running through neuropil |
| Glial wrapping | Thin astrocytic processes wrap around neurites; model confuses glial membrane for neuronal continuity | Perisynaptic astrocyte processes |
| Alignment artifacts | Section-to-section registration errors shift a membrane out of alignment, creating an apparent connection | Regions with tissue folds or tears |
2.3 Downstream Impact
- Connectivity graph corruption: A merge between neuron A and neuron B means every synapse onto A is also attributed to B and vice versa. The connectivity matrix gains false edges.
- Inflated morphological statistics: Cell volume, total cable length, and branch count are all overestimated for the merged segment.
- Artificial motifs: Network motif analysis (e.g., reciprocal connections, feed-forward triplets) can produce false positives when merges create phantom connections.
2.4 Visual Signatures
- Impossible branching in 3D: A branch point where two branches diverge at nearly 180 degrees from each other (going in opposite directions) is almost never biological. Real branch points tend to have smaller angles.
- Sudden caliber changes: If a 500-nm-diameter dendrite suddenly becomes a 100-nm axon at a branch point, suspect a merge.
- Biologically implausible morphology: A segment that crosses brain region boundaries it should not, or that has an impossibly large arbor for its cell type.
2.5 Worked Example: Identifying a Merge Error
- You are examining a 3D mesh of a putative pyramidal cell.
- The cell has a normal-looking apical dendrite, but one basal branch suddenly changes caliber from ~400 nm to ~120 nm and takes a sharp 90-degree turn.
- You navigate to the turn point in 2D (XY) slices.
- In slices z = 312-314, you see two distinct membrane-bounded profiles that are separated by a visible (but faint) membrane in z = 311 and z = 315, but in z = 313 the membrane is absent and the two profiles are merged into one label.
- Diagnosis: merge error caused by a one-section gap in membrane signal.
- Action: split at the merge point.
- Verification: after splitting, each segment has consistent caliber and biologically plausible trajectory.
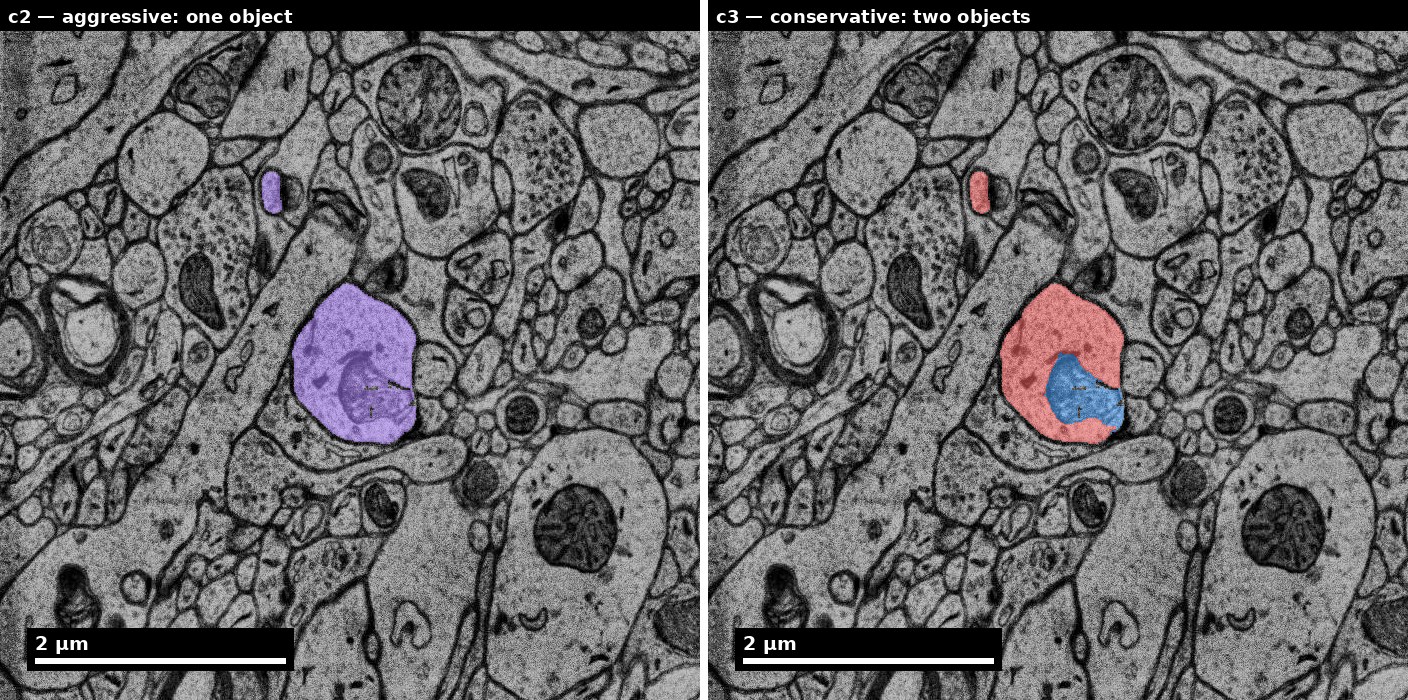
scripts/render_em_figures.py.
3. Split Errors
3.1 Definition
A split error occurs when a single neuron is broken into two or more disconnected segments. In the supervoxel graph, a true edge is missing.
3.2 Causes
| Cause | Mechanism | Typical context |
|---|---|---|
| Thin processes | Axons < 100 nm diameter drop below reliable detection | Small-caliber axons in cortical neuropil |
| Low contrast regions | Membrane signal too faint for model confidence | Same as merge causes, but model errs conservatively |
| Missing or damaged sections | Physical section lost during collection | Any region; creates a gap in z |
| Sharp turns in z | A process that curves sharply between sections appears to “jump” in xy | Ascending/descending axons |
| Alignment errors | Misregistration makes a continuous process appear discontinuous | Tissue fold boundaries |
3.3 Downstream Impact
- Missing connections: If a neuron is split, synapses on the disconnected fragment are attributed to an orphan segment rather than the parent neuron. The connectivity matrix loses true edges.
- Underestimated arbor: Cable length, branch count, and volume are all underestimated.
- Inflated cell counts: Each fragment may be counted as a separate neuron in census analyses.
3.4 Visual Signatures
- Dead-end processes: A neurite that terminates abruptly without a synaptic bouton or growth cone. Biological terminations are rare in adult tissue outside of specific contexts (e.g., axon terminals with vesicles).
- Orphan fragments: Small segments near the dead end that match in caliber and trajectory.
- Size distribution anomalies: An excess of very small segments in a region suggests widespread splitting.
3.5 Worked Example: Identifying a Split Error
- You are tracing a descending axon from a layer 2/3 pyramidal cell.
- At z = 487, the axon segment ends abruptly. There is no terminal bouton.
- You scroll to z = 488. Section 488 is visibly damaged (knife mark across the tissue). The axon profile is not segmented in this section.
- At z = 489, a small orphan fragment appears at approximately the same (x, y) position, with matching caliber (~130 nm) and trajectory.
- Diagnosis: split error caused by a damaged section.
- Action: merge the upstream segment with the downstream fragment.
- Verification: the merged segment has smooth, continuous trajectory across the damaged section.
4. Boundary Errors
4.1 Definition
A boundary error occurs when the membrane position is shifted relative to ground truth, causing partial volume sharing between adjacent segments. Neither segment is topologically wrong (no false merge, no false split), but the exact border is inaccurate.
4.2 Impact
- Synapse misassignment: A synapse located near the true membrane may be attributed to the wrong neuron if the predicted boundary is shifted by even 2-3 voxels. This is especially problematic for small synapses with tight postsynaptic compartments (e.g., spine heads).
- Morphology distortion: Measurements of neurite diameter, spine volume, and organelle distribution are corrupted.
- Silent corruption: Unlike merge/split errors, boundary errors rarely produce dramatic visual signatures. They tend to be discovered only when quantitative measurements disagree with expectations.
4.3 Worked Example
- You are measuring spine head volumes for a population of excitatory synapses. Several spine heads have volumes 30-40 % larger than expected.
- On inspection, the segmentation boundary around those spines extends 2-3 voxels into the adjacent dendritic shaft or into the presynaptic bouton.
- Diagnosis: boundary error. The spine volume is inflated by the extra voxels.
- Action: manual boundary correction or exclude affected spines from quantitative analysis.
5. Identity Errors
5.1 Definition
An identity error occurs when the segmentation boundary is correct, but the cell label assigned to a region is wrong. This typically happens as a side effect of proofreading itself: when a merge is split, the two resulting fragments must each receive a label, and the wrong label may be propagated to the wrong fragment.
5.2 Impact
- Catastrophic for connectivity: Every synapse in the mislabeled region is attributed to the wrong neuron. If the mislabeled region is large, this can completely corrupt the connectivity profile of two neurons.
- Rare but hard to detect: Because the boundary looks correct, the error is invisible in standard 2D or 3D inspection. It is usually discovered only when downstream connectivity analysis produces impossible results (e.g., a known inhibitory neuron appearing to make excitatory synapses).
5.3 Worked Example
- After splitting a merge between neuron A (inhibitory basket cell) and neuron B (excitatory pyramidal cell), the proofreader assigns the perisomatic basket terminals to neuron B by mistake.
- Downstream analysis flags neuron B as making an unusual number of perisomatic synapses, inconsistent with pyramidal cell biology.
- Re-inspection reveals the identity swap.
- Action: reassign the segment to neuron A.
6. Relative Frequency and Impact Hierarchy
There is no field-wide error frequency distribution, and you should be suspicious of any table that offers one. The merge/split ratio is not a property of connectomics; it is an output of the agglomeration threshold, which is a dial the pipeline sets. Plaza, Scheffer & Chklovskii (2014) make the point directly: a conservative (high) threshold produces more splits and fewer merges, and an aggressive (low) threshold does the reverse. Two groups running different thresholds on the same volume get different distributions, and both are correct about their own data.
So the useful hierarchy is by cost, which is stable across pipelines, rather than by frequency, which is not:
| Error type | Downstream impact | Detectability | Cost to fix |
|---|---|---|---|
| Merge | Very high — manufactures connections that do not exist, and propagates along the merged object | Poor. The merged object still looks like a plausible neuron | High: requires locating the join, often across many sections |
| Split | High — removes real connections, biased toward thin processes | Good. Dead ends are visible and searchable | Low: joining is a single operation |
| Boundary | Moderate — biases spine volume, bouton size, synapse area | Poor. Only visible quantitatively | Moderate |
| Identity | Very high per instance | Very poor | High, and often introduced by proofreading |
The asymmetry that matters is between the second and third columns: the errors that are easy to see are the cheap ones. A segmentation tuned to minimize visible error is tuned to maximize the error that corrupts connectivity.
What to measure on your own volume
Rather than importing a frequency table, get the distribution for the pipeline and tissue you are actually working with:
- Take a small subvolume and reconstruct it densely by hand, or use an existing gold standard for the same dataset.
- Compare against the automated segmentation, and count merges and splits separately. Report them separately — a summed VI hides which dominates.
- Repeat at two agglomeration thresholds. The change between them tells you how much of your error population is a choice rather than a limitation.
That number is worth more than any published range, because it is the one your proofreading budget has to absorb. Unit 03’s pilot reconstruction exists for exactly this purpose, and Unit 08’s planning lab is built around it.
On automated error detection
Detector performance is likewise pipeline- and dataset-specific, and is reported per class. Two things hold generally enough to plan around: recall is lower for splits than for merges, and no current detector is complete enough that a human verification pass on a sample can be skipped. Quote the recall figure from the detector you are using, on data resembling yours — not a range from a review.
7. Common Misconceptions
| Misconception | Reality |
|---|---|
| “Superhuman accuracy means proofreading is unnecessary.” | Superhuman refers to voxel-level accuracy on small benchmarks. At connectome scale, even small error rates compound to near-certainty of errors per neuron. |
| “Merge errors are always obvious in 3D.” | Small merges (e.g., two thin axons fused for a few sections) can be nearly invisible in 3D mesh views. They are often found only through connectivity analysis. |
| “Split errors are less harmful than merge errors.” | For connectivity analysis, split errors cause missing edges, which can be just as damaging as the false edges from merges, depending on the scientific question. |
| “Boundary errors don’t matter.” | For any analysis involving synapse assignment or fine morphological measurement (spine volume, bouton size), boundary errors are critically important. |
| “More proofreading always helps.” | Poorly executed proofreading can introduce new errors (especially identity errors). Quality-controlled proofreading with verification is essential. |
| “Automated error detection finds all errors.” | No current detector is complete. Recall is reported per class and is consistently lower for splits than for merges, so a human verification pass on a sample cannot be skipped. Quote the figure from the detector you are actually running. |
8. References
- Berger, D. R., Seung, H. S., & Lichtman, J. W. (2018). VAST (Volume Annotation and Segmentation Tool): Efficient manual and semi-automatic labeling of large 3D image stacks. Frontiers in Neural Circuits, 12, 88.
- Funke, J., Tschopp, F., Grisaitis, W., Sherber, A., Singh, C., Saalfeld, S., & Turaga, S. C. (2017). A deep structured learning approach towards automating connectome reconstruction from 3D electron microscopy data. arXiv preprint arXiv:1709.02974.
- Lee, K., Zung, J., Li, P., Jain, V., & Seung, H. S. (2017). Superhuman accuracy on the SNEMI3D connectomics challenge. arXiv preprint arXiv:1706.00120.
- Plaza, S. M., Scheffer, L. K., & Chklovskii, D. B. (2014). Toward large-scale connectome reconstructions. Current Opinion in Neurobiology, 25, 201-210.
- Schneider-Mizell, C. M., et al. (2016). Quantitative neuroanatomy for connectomics in Drosophila. eLife, 5, e12059.
End of instructor script: Error Taxonomy in Connectome Proofreading