Slide 1 of 31
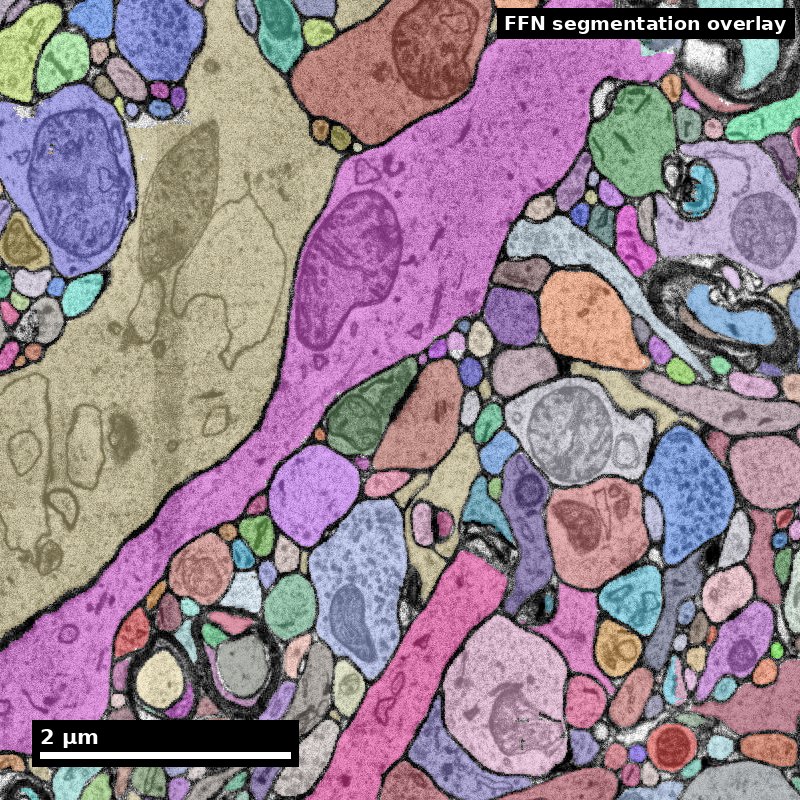 Nanoscale · Module 18
Data Cleaning and Preprocessing
Teaching Deck
Human cortex · H01
Object segmentation over electron microscopy
H01 release · Lichtman Lab / Harvard & Connectomics at Google · CC BY 4.0
Shapson-Coe et al. (2024) · doi:10.1126/science.adk4858
Slide 2 of 31
Learning Objectives
- Diagnose common connectomics data-quality issues before analysis
- Apply reproducible preprocessing steps with documented decision rules
- Quantify preprocessing impact with auditable QC metrics
- Produce an analysis-ready dataset package with provenance metadata
Slide 3 of 31
Capability Target
Produce a reproducible preprocessing release that transforms raw or intermediate connectomics outputs into analysis-ready data, with explicit quality gates and full provenance. Students will be able to identify the specific cleaning operations that shape biological conclusions, justify every threshold decision, and document their preprocessing pipeline so that another researcher can audit and reproduce it.
Slide 4 of 31
Concept Focus
1) Data cleaning in connectomics: what needs fixing and why
- Technical: connectomics datasets arrive with characteristic quality issues that must be addressed before analysis:
- Synapse table filtering: automated synapse detection produces false positives (cleft detections at non-synaptic locations) and false negatives (missed synapses). Filtering typically uses a confidence score threshold (e.g., cleft score > 50 in CAVE synapse tables). The choice of threshold directly affects edge weights in the connectivity graph.
Slide 5 of 31
Concept Focus (continued)
- Segment size thresholding: automated segmentation produces many small fragments --- bits of neuropil, partial dendrites, glia misclassified as neurons.
- Removing orphan fragments: segments that have no synaptic connections to any other segment are orphans. They typically represent segmentation debris or incomplete reconstructions. Including them inflates node counts and distorts network metrics.
Figure description and teaching notes
Further teaching detail from the module:
**Segment size thresholding:** automated segmentation produces many small fragments --- bits of neuropil, partial dendrites, glia misclassified as neurons. Including these in analysis adds noise. Common practice is to exclude segments below a volume or synapse count threshold (e.g., segments with fewer than 2 synapses as pre- or post-synaptic partner).
Slide 6 of 31
Concept Focus (continued)
- Handling neurons at volume boundaries: neurons whose arbors are truncated by the edge of the imaged volume have artificially low synapse counts and incomplete morphologies.
- Duplicate and conflicting IDs: merges and splits during proofreading can create duplicate entries or conflicting segment-to-cell-type mappings that must be resolved.
Figure description and teaching notes
Further teaching detail from the module:
**Handling neurons at volume boundaries:** neurons whose arbors are truncated by the edge of the imaged volume have artificially low synapse counts and incomplete morphologies. These boundary neurons can be flagged (e.g., by checking whether the segment mesh intersects the volume bounding box) and either excluded or analyzed with explicit caveats.
Slide 7 of 31
Concept Focus (continued)
- Plain language: connectomics data is not "clean" when you receive it.
- Misconception guardrail: "raw data is always better." In connectomics, raw segmentation output contains systematic artifacts that will corrupt analysis if left uncleaned. The question is not whether to clean, but how to clean transparently.
Figure description and teaching notes
Further teaching detail from the module:
**Plain language:** connectomics data is not "clean" when you receive it. Segmentation makes mistakes, synapse detection has false alarms, and the edges of the volume cut through neurons. You must fix these issues before analysis, but every fix is a decision that affects your results.
Slide 8 of 31
Core Workflow
- Ingest and integrity validation
- Confirm file completeness, schema conformance, and version compatibility.
- Log dataset identifiers, CAVE materialization version, and checksums.
- Verify that the synapse table, segment table, and cell-type annotations refer to the same materialization.
Slide 9 of 31
Core Workflow (continued)
- Artifact and anomaly screening
- Compute segment size distribution and flag outliers (extremely large segments may be merge errors; extremely small segments may be debris).
- Compute synapse confidence score distribution and identify the threshold region.
- Check for duplicate segment IDs, conflicting cell-type labels, and missing foreign keys.
Slide 10 of 31
Core Workflow (continued)
- Identify boundary neurons by mesh-bounding-box intersection.
Slide 11 of 31
Core Workflow (continued)
- Triage issues by likely biological impact: high-impact issues block analysis; low-impact issues are documented and accepted.
Slide 12 of 31
Core Workflow (continued)
- Cleaning transforms
- Apply synapse confidence threshold with documented rationale.
- Remove orphan segments (zero synapses as both pre and post).
- Apply segment size threshold with documented rationale.
Slide 13 of 31
Core Workflow (continued)
- Flag or remove boundary neurons with documented policy.
- Resolve duplicate IDs and label conflicts.
Slide 14 of 31
Core Workflow (continued)
- Normalize units (e.g., convert voxel coordinates to nanometers using dataset resolution metadata).
Slide 15 of 31
Core Workflow (continued)
- QC and drift checks
- Compare pre/post distributions: synapse count per neuron, segment size, graph density, degree distribution.
- Verify that cleaning did not selectively remove a specific cell type or spatial region.
- Check that graph topology statistics (clustering coefficient, connected components) are consistent with expectations.
Slide 16 of 31
Core Workflow (continued)
- Release packaging
- Publish analysis-ready tables plus: preprocessing decision log, transform code with commit hash, QC metric report with threshold justifications, known limitations and residual risks.
Slide 17 of 31
Run of Show (60 min)
- 00:00-08:00 | Setup and target framing
- 08:00-18:00 | Instructor modeling: ingest and anomaly screening
- 18:00-32:00 | Team preprocessing design
- 32:00-44:00 | QC pass
Figure description and teaching notes
Materials
One noisy connectomics table (synapse table with low-confidence entries, duplicate IDs, and missing cell-type labels).
Segment table with size distribution spanning 5 orders of magnitude.
Shared preprocessing decision sheet (printed or digital template).
QC dashboard template (pre/post metric comparison).
Timing and instructor script
00:00-08:00 | Setup and target framing
Instructor presents the scenario: "You have received a connectomics export. Before you can analyze it, you must clean it. But every cleaning decision changes your results. Today we learn to clean responsibly." Display the raw data summary statistics. Define the release objective: an analysis-ready synapse table and neuron table with documented provenance. Define non-negotiable quality gates: no duplicate IDs, no unresolved foreign keys, all thresholds documented.
08:00-18:00 | Instructor modeling: ingest and anomaly screening
Live demonstration: load the synapse table, compute the confidence score distribution, identify the bimodal peak (true synapses vs false positives). Show the segment size distribution on a log scale, point out the debris tail. Check for orphan IDs. Key script line: "Before you touch the data, understand its shape. The distribution plot is your first diagnostic tool."
18:00-32:00 | Team preprocessing design
Teams of 3-4 draft cleaning rules for each identified issue. Each team must produce a preprocessing decision table with columns: issue, proposed action, threshold, rationale, estimated impact. Instructor circulates, challenging threshold choices: "Why 50 and not 40? What do you lose at 50 that you keep at 40?"
32:00-44:00 | QC pass
Teams compute (or estimate from the provided distributions) pre/post metrics: total synapse count, total segment count, mean synapses per neuron, fraction of each cell type remaining. Teams make a release/no-release decision based on their quality gates. Instructor asks: "Did cleaning change the relative representation of cell types? If it did, that is a bias you must report."
44:00-54:00 | Cross-team review
Teams swap preprocessing decision tables and QC reports. Each team audits the other's transform log for: missing rationale, unjustified thresholds, potential biological signal loss, and reproducibility gaps. Teams write two specific improvement suggestions.
54:00-60:00 | Competency checkpoint
Each team submits one release note with: dataset version, all thresholds and parameters, QC metrics with pass/fail, and at least one documented residual risk. Instructor reviews one example live.
Success criteria for this session
Cleaning decisions are deterministic, justified, and documented in real time.
QC thresholds are tied to operational actions (not just reported).
Release note exposes at least one unresolved interpretation risk.
Slide 18 of 31
Run of Show (60 min) (continued)
- 44:00-54:00 | Cross-team review
- 54:00-60:00 | Competency checkpoint
Slide 19 of 31
Misconceptions to Watch
- Misconception guardrail: "raw data is always better." In connectomics, raw segmentation output contains systematic artifacts that will corrupt analysis if left uncleaned. The question is not whether to clean, but how to clean transparently.
- Misconception guardrail: there is no single "correct" threshold. If your result depends on a specific threshold choice, it is fragile and should be reported with a sensitivity analysis.
Slide 20 of 31
Misconceptions to Watch (continued)
- Misconception guardrail: more filtering is not always better. Aggressive cleaning can create the appearance of clean results while actually removing biological signal.
Slide 21 of 31
Misconceptions to Watch (continued)
- Misconception guardrail: version-control notes alone are insufficient without data lineage. Git tracks code changes, but you also need to track which data version was processed with which code version.
- Misconception guardrail: documenting preprocessing after the fact is unreliable. Document decisions in real time.
- Misconception guardrail: reporting metrics without thresholds is not quality control. Every metric needs an associated action.
Slide 22 of 31
Studio Activity
Scenario: Your team receives a connectomics export from MICrONS minnie65 (CAVE materialization v795) containing: a synapse table (4.2 million rows) with confidence scores, a segment table (120,000 segments) with volumes, and a cell-type annotation table (8,400 classified neurons). Initial inspection reveals: 12% of synapses have confidence scores below 30, 35,000 segments have fewer than 2 synapses, 847 segments intersect the volume bounding box, and 23 segment IDs appear in the synapse table but not in the segment table.
Slide 23 of 31
Activity Output Checklist
- Evidence-linked artifact submitted.
- At least one limitation or uncertainty stated.
- Revision point captured from feedback.
Slide 24 of 31
Assessment Rubric
Minimum pass
- Cleaning decisions are explicit, justified, and reproducible.
- QC metrics include thresholds tied to concrete actions.
- Release package includes provenance metadata (dataset version, code commit, parameters).
Slide 25 of 31
Assessment Rubric
Strong performance
- Distinguishes low-risk cleanup from biologically sensitive transforms with explicit reasoning.
- Includes sensitivity analysis: "If we move the synapse threshold from 50 to 30, X% more edges appear and Y motifs change significance."
- Documents limitations and unresolved risks transparently, including what biological signal may have been lost.
Slide 26 of 31
Assessment Rubric
Common failure modes
- Silent ad-hoc edits with no transform log.
- Aggressive filtering that removes biologically meaningful variation without acknowledgment.
- Metrics reported without operational thresholds.
- Missing dataset version or code commit in the release note.
Slide 27 of 31
Exit Ticket
Take one connectomics table (real or mock) and write:
- Three cleaning rules with rationale tied to specific data artifacts.
- Two QC thresholds with associated pass/fail actions and biological justification.
- One sensitivity analysis: what happens to your key metric if you relax or tighten your primary threshold by 20%?
Slide 28 of 31
Exit Ticket (continued)
- One limitation that remains after preprocessing, stated concretely enough to guide interpretation.
Slide 29 of 31
References (Instructor)
- Wilkinson et al., 2016. The FAIR Guiding Principles for scientific data management and stewardship.
- Peng, 2011. Reproducible Research in Computational Science.
- MICrONS and related connectomics workflow documentation.
Slide 30 of 31
Teaching Materials
- Module page: /modules/module18/
- Session kit: /teaching/sessions/module18/
- Worksheet: /assets/worksheets/module18/module18-activity.md
Slide 31 of 31
Read, review, or teach
The reading version includes figure descriptions and discussion guidance.
Nanoscale text: CC BY 4.0. Scientific figures retain their individual credits.