Slide 1 of 21
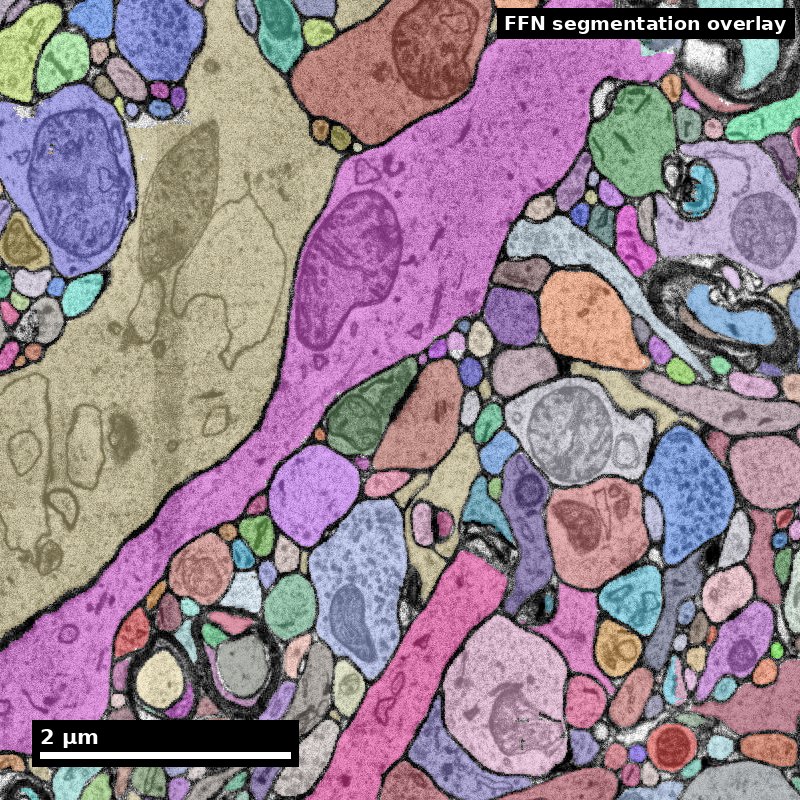 Nanoscale · Module 09
Neuron Morphology and Skeletonization
Teaching Deck
Human cortex · H01
Object segmentation over electron microscopy
H01 release · Lichtman Lab / Harvard & Connectomics at Google · CC BY 4.0
Shapson-Coe et al. (2024) · doi:10.1126/science.adk4858
Slide 2 of 21
Learning Objectives
- Generate skeleton representations from reconstructed neurites
- Compute core morphology descriptors
- Relate morphology metrics to biological interpretation
- Report morphology uncertainty and classification limits
Slide 3 of 21
Capability Target
Produce a skeleton-based morphology summary with at least three descriptors and one explicit limitation.
Slide 4 of 21
Concept Focus
1) What is skeletonization and why do we need it?
A segmented neuron occupies millions of voxels in the EM volume. To analyze its morphology efficiently, we reduce it to a skeleton: a tree graph where nodes represent points along the neurite centerline and edges represent the path between them. Skeletons compress a neuron's 3D structure from gigabytes to kilobytes while preserving topology (branching pattern, path lengths, connectivity) — at the cost of surface geometry and spine shape, which are discarded.
Slide 5 of 21
Core Workflow
- Build skeleton from volumetric segmentation using TEASAR or equivalent algorithm.
- Quality-check the skeleton: prune spurious branches, verify branch points, check for disconnected fragments.
- Compute descriptors: cable length, branch points, Strahler number, Sholl profile, spine density.
- Compare against reference patterns: does this neuron match the expected morphology for its putative cell type?
Slide 6 of 21
Core Workflow (continued)
- Report interpretation confidence: which descriptors are robust, which are affected by reconstruction quality?
Slide 7 of 21
Run of Show (60 min)
- 00:00-10:00 | Morphology overview
- 10:00-24:00 | Skeleton extraction demo
- 24:00-38:00 | Descriptor calculation
- 38:00-50:00 | Interpretation and caveats
Figure description and teaching notes
Pre-class preparation (10 min async)
Review the data formats content library entry (skeletons section)
Install/check NeuroM or equivalent morphology analysis package
Minute-by-minute plan
00:00-10:00 | Morphology overview
"Why do we care about neuron shape?" — Shape constrains function: a neuron's dendritic arbor determines what inputs it can receive; its axonal arbor determines where it can send output.
Show 3 neuron types (pyramidal, basket, Martinotti) and their characteristic morphologies.
"Today you'll learn to quantify these shapes from EM data."
10:00-24:00 | Skeleton extraction demo
Live demo: take a segmented neuron, run skeletonization, visualize result in Neuroglancer.
Walk through SWC format: "Each line is a node. Parent ID tells you the tree structure."
Common pitfall: show a skeleton with spurious branches from noisy segmentation. Demonstrate pruning.
24:00-38:00 | Descriptor calculation
Hands-on: learners compute 5 descriptors for one neuron using NeuroM or provided scripts.
Compare results across the group: did everyone get the same numbers? Discuss sources of variation.
Introduce Sholl analysis with live visualization.
38:00-50:00 | Interpretation and caveats
"Your neuron has total cable length of 2,100 μm and 47 branch points. Is that a lot?" — Compare to published values for the putative cell type.
Discussion: which descriptors are robust to reconstruction errors? (Cable length is sensitive to splits; branch count is sensitive to both splits and spurious branches; spine density is robust if the segmentation boundary is accurate.)
"What if 30% of the arbor is outside the volume? How does that change your interpretation?"
50:00-60:00 | Competency check
Each learner submits their morphology descriptor table with:
At least 3 descriptors with values
Putative cell-type classification based on morphology
One explicit limitation of the measurement
Exit ticket: "Name one morphology feature that could be confounded by reconstruction quality."
Slide 8 of 21
Run of Show (60 min) (continued)
- 50:00-60:00 | Competency check
Slide 9 of 21
Misconceptions to Watch
- Misconception guardrail: a skeleton is a lossless summary of a neuron.
- Misconception guardrail: morphological measurements are comparable across cells that were proofread to different levels.
- Misconception guardrail: total dendritic length is a property of the neuron itself, independent of how it was reconstructed.
- Misconception guardrail: a cell type assigned from morphology alone needs no corroboration from connectivity or molecular identity.
Slide 10 of 21
A skeleton makes measurement choices explicit
Synthetic planar tree. Coordinates are in micrometres.
A (0, 0)
Root
A–B: 3 µm
B (0, 3)
Branch point
C (−4, 3)
B–C: 4 µm
D (4, 3)
B–D: 4 µm
Discuss: Compute total cable length and both root-to-tip path lengths.
Synthetic fixture; exact geometry checked by scripts/check_visual_design.rb.
Figure description and teaching notes
Visual description and discussion guidance:
Root A is (0,0), B is (0,3), C is (-4,3), and D is (4,3). Edges A–B, B–C and B–D measure 3, 4 and 4 micrometres. Total length is 11; each root-to-tip path is 7. There is one branching node, B, and two terminal nodes, C and D. Root-to-tip Euclidean distance is 5, so tortuosity is 7/5 = 1.4 under that definition.
Slide 11 of 21
A missing branch changes the story
Use the synthetic tree on the previous slide.
- 1
Complete example
Three edges: total length 11 µm.
- 2
Truncated example
Remove B–D: measured length is 7 µm.
- 3
Report the limit
The lower value describes the observed reconstruction.
Discuss: Does a lower measurement prove a smaller biological arbor?
Illustrative teaching scenario; see this module’s lesson and worked example.
Figure description and teaching notes
Visual description and discussion guidance:
Removing the four-micrometre B–D edge changes the observed total from 11 to 7. That does not establish that the biological cell had a smaller arbor. Report what was reconstructed and how missing structure affects interpretation.
Slide 12 of 21
Studio Activity
Scenario: You have skeletons for 10 neurons in L2/3 of mouse visual cortex. Your task is to classify them as pyramidal vs interneuron based on morphology alone, then validate against synapse-based classification (excitatory vs inhibitory output synapses).
Slide 13 of 21
Activity Output Checklist
- Evidence-linked artifact submitted.
- At least one limitation or uncertainty stated.
- Revision point captured from feedback.
Slide 14 of 21
Assessment Rubric
Minimum pass
- Valid skeleton and descriptor set for all 10 neurons, with at least 3 descriptors each.
- Every classification carries a stated evidence chain, not just a label.
- At least one explicit measurement limitation named, tied to a specific reconstruction issue.
Slide 15 of 21
Assessment Rubric
Strong performance
- Descriptors partitioned into robust versus reconstruction-sensitive for each borderline cell.
- Mismatches between morphological and synapse-based calls traced to a root cause (truncation, split, spurious branches) rather than logged as disagreement.
- Per-cell completeness estimated and reported next to every absolute measurement.
Slide 16 of 21
Assessment Rubric (continued)
- Ratios computed on contained compartments wherever truncation is present.
Slide 17 of 21
Assessment Rubric
Common failure to flag
- Descriptor list without biological context — numbers with no statement of what they mean for identity.
- Classification from a single descriptor when the others disagree.
- Absolute cable length or arbor volume reported for truncated cells without a lower-bound qualifier.
Slide 18 of 21
Exit Ticket
Explain one morphology feature that could be confounded by reconstruction quality.
Slide 19 of 21
References (Instructor)
- Use module references listed on the module page.
Slide 20 of 21
Teaching Materials
- Module page: /modules/module09/
- Session kit: /teaching/sessions/module09/
- Worksheet: /assets/worksheets/module09/module09-activity.md
Slide 21 of 21
Read, review, or teach
The reading version includes figure descriptions and discussion guidance.
Nanoscale text: CC BY 4.0. Scientific figures retain their individual credits.