Slide 1 of 22
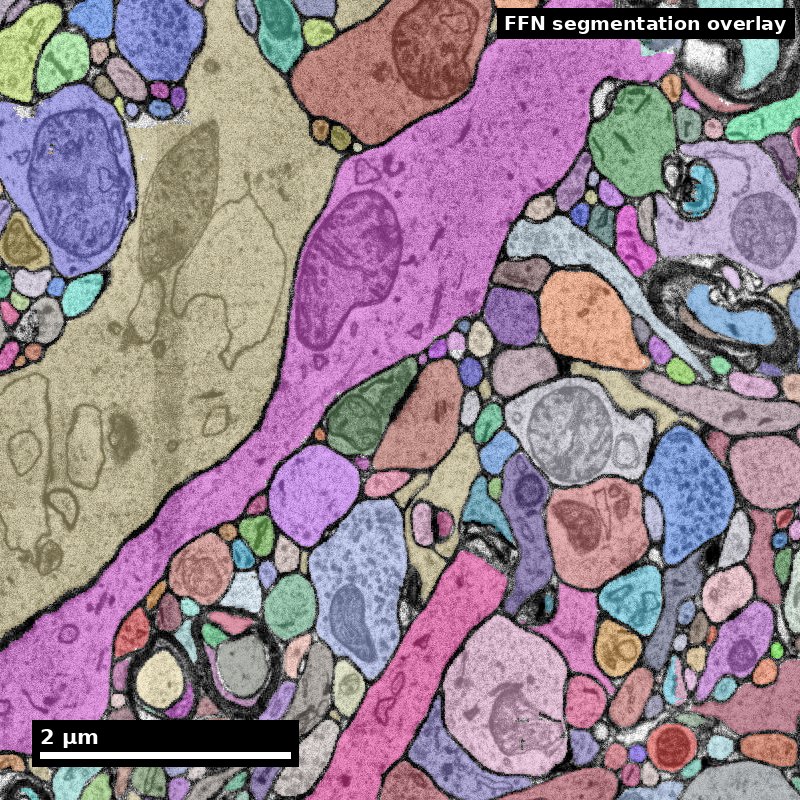 Nanoscale · Module 08
Hypothesis Testing in Connectomics
Teaching Deck
Human cortex · H01
Object segmentation over electron microscopy
H01 release · Lichtman Lab / Harvard & Connectomics at Google · CC BY 4.0
Shapson-Coe et al. (2024) · doi:10.1126/science.adk4858
Slide 2 of 22
Learning Objectives
- Translate biological questions into testable hypotheses
- Select metrics and null models for structural data
- Interpret outcomes with uncertainty discipline
- Separate supported claims from exploratory signals
Slide 3 of 22
Capability Target
Design one hypothesis test with metric, null model, and interpretation boundary statement.
Slide 4 of 22
Concept Focus
1) What makes a connectomics hypothesis testable?
A testable connectomics hypothesis must specify: (a) a structural feature that can be measured from the reconstructed data (e.g., synapse count, motif frequency, path length), (b) a comparison or null expectation (e.g., "more frequent than in a degree-preserving random graph"), and (c) an interpretation boundary (what the result does and does not prove). Many fascinating biological questions ("How does the cortex generate consciousness?") are not directly testable with connectomics because they lack measurable structural endpoints.
Slide 5 of 22
Core Workflow
- Define question and estimand: what structural feature would constrain or inform the biological question?
- Choose measurable outputs: specific metric(s) computed from the connectome graph.
- Select null model: the most stringent null relevant to the claim.
- Test and interpret results: compute metric, compare to null distribution, compute z-score and p-value.
Slide 6 of 22
Core Workflow (continued)
- Document supported vs unsupported claims: what the result proves, what it doesn't, and what additional evidence would be needed.
Slide 7 of 22
Run of Show (60 min)
- 00:00-08:00 | Framing: good vs bad hypotheses
- 08:00-20:00 | Hypothesis drafting
- 20:00-34:00 | Metric and null model selection
- 34:00-46:00 | Interpretation workshop
Figure description and teaching notes
Pre-class preparation (10 min async)
Read the motif analysis content library entry (focus on null models section)
Draft one biological question you'd like to test with connectomics data
Minute-by-minute plan
00:00-08:00 | Framing: good vs bad hypotheses
Show 4 example hypotheses (2 good, 2 poor). Group identifies which are testable and why.
Key criteria: measurable endpoint, specified null, interpretation boundary.
08:00-20:00 | Hypothesis drafting
Each learner drafts a hypothesis using a template:
"In [dataset/region], [structural feature] is [comparison] compared to [null model]."
"This would support [interpretation] but would NOT prove [over-claim]."
Peer review: partner evaluates whether the hypothesis is testable.
20:00-34:00 | Metric and null model selection
For each drafted hypothesis, select the appropriate metric and null model.
Instructor walks through one example end-to-end: hypothesis → metric → null → expected result → interpretation.
Discussion: "What happens if you use the wrong null model?" Show how the same data looks significant or non-significant depending on null choice.
34:00-46:00 | Interpretation workshop
Present 3 pre-computed results (with p-values and z-scores). For each, learners write:
Supported claim (what the data shows)
Explicit non-claim (what the data does NOT show)
One confound that could explain the result
Group discussion of each result.
46:00-60:00 | Competency check
Each learner submits their final hypothesis with metric, null model, and interpretation boundaries.
Exit ticket: "Write one claim and one explicit non-claim from the same test outcome."
Slide 8 of 22
Run of Show (60 min) (continued)
- 46:00-60:00 | Competency check
Slide 9 of 22
Misconceptions to Watch
- Misconception guardrail: a significant result against a random-graph null is evidence of biological structure.
- Misconception guardrail: the statistical test is the scientific step, when the choice of null model is.
- Misconception guardrail: a metric can be chosen after seeing the data without cost to the inference.
- Misconception guardrail: reporting the tests that worked is sufficient without reporting how many were run.
Slide 10 of 22
Connect the question to the comparison
A structural claim needs a measurable endpoint.
- 1
Hypothesis
Which pattern and sample?
- 2
Metric
What will be measured?
- 3
Null model
What does the comparison preserve?
- 4
Boundary
What does this not establish?
Discuss: Which assumption does your null model leave untested?
Illustrative teaching scenario; see this module’s lesson and worked example.
Figure description and teaching notes
Visual description and discussion guidance:
Different null models preserve different properties. A finding is conditional on the comparison and sampling design; structural association alone does not establish function or causation.
Slide 11 of 22
A difference is not yet a conclusion
Hypothetical counts, supplied to discuss interpretation.
| Quantity | Count |
|---|---|
| Observed reciprocal pairs | 12 |
| Median across null graphs | 8 |
Discuss: What is missing before calling this evidence of enrichment?
Synthetic scenario; Module 08 metric, null model and interpretation workflow.
Figure description and teaching notes
Visual description and discussion guidance:
Twelve is four more than eight, but no null distribution, sample size, sampling unit or uncertainty is supplied. A ratio of 1.5 alone does not establish statistical significance or a mechanism. Ask how the null graphs were produced and what they preserve.
Slide 12 of 22
Studio Activity
Scenario: Your lab is planning a study of feedforward vs feedback connectivity in mouse visual cortex using the MICrONS dataset. You need to design three testable hypotheses about the circuit architecture.
Slide 13 of 22
Activity Output Checklist
- Evidence-linked artifact submitted.
- At least one limitation or uncertainty stated.
- Revision point captured from feedback.
Slide 14 of 22
Assessment Rubric
Minimum pass
- At least 2 of 3 hypotheses name a measurable structural endpoint, a specific comparison, and a null model — a reader could run the test from the sheet alone.
- Each testable hypothesis states one supported claim and one explicit non-claim, and the two are different in content, not restatements.
- The metric's scope (local vs global, per-pair vs per-population) matches the scope of the hypothesis it tests.
Slide 15 of 22
Assessment Rubric (continued)
- The required dataset version is stated for each hypothesis.
Slide 16 of 22
Assessment Rubric
Strong performance
- Null model choice is justified in words: the "uninteresting explanation" the null encodes is written out before the test is described.
- At least one hypothesis is evaluated under two nulls of different stringency, with a prediction of how the effect size should move.
- The analysis plan states how many tests will be run and names the correction, including tests that may go unreported.
Slide 17 of 22
Assessment Rubric (continued)
- Peer critique identifies at least one genuine weakness per hypothesis (a confound, an over-claim, a metric mismatch), and the revision visibly responds to it.
Slide 18 of 22
Assessment Rubric
Common failure to flag
- Vague hypothesis without measurable endpoint ("we will study connectivity patterns").
- Missing or default null model — Erdos-Renyi used where degree structure obviously matters.
- A functional claim ("this circuit computes X") stated as the hypothesis rather than as an interpretation boundary.
Slide 19 of 22
Exit Ticket
Write one claim and one explicit non-claim from the same test outcome.
Slide 20 of 22
References (Instructor)
- Use module references listed on the module page.
Slide 21 of 22
Teaching Materials
- Module page: /modules/module08/
- Session kit: /teaching/sessions/module08/
- Worksheet: /assets/worksheets/module08/module08-activity.md
Slide 22 of 22
Read, review, or teach
The reading version includes figure descriptions and discussion guidance.
Nanoscale text: CC BY 4.0. Scientific figures retain their individual credits.