Slide 1 of 20
 Nanoscale · Module 01
Scientific Curiosity and Motivation
Teaching Deck
Human cortex · H01
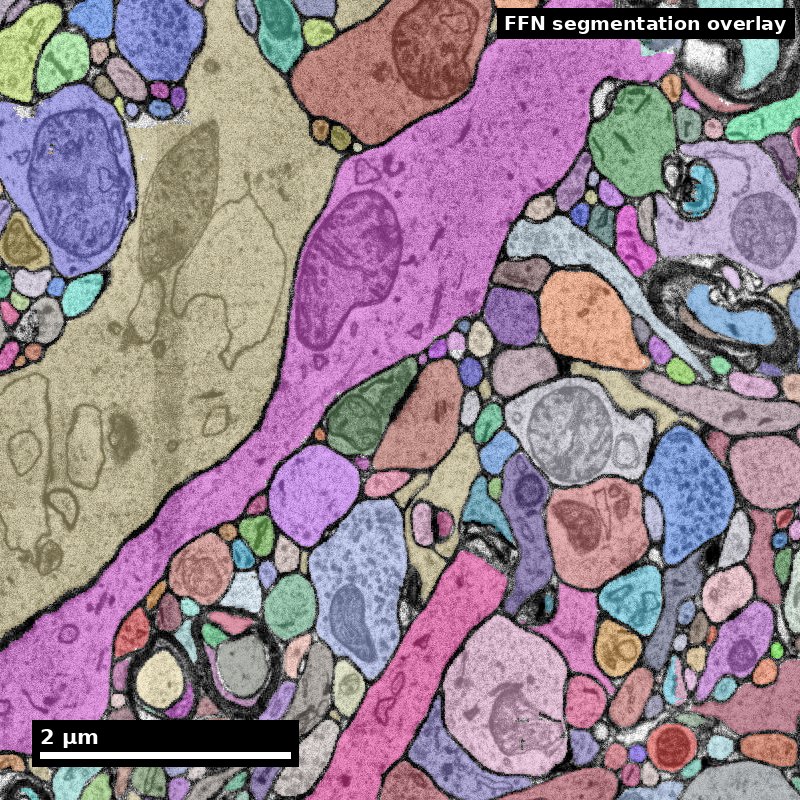
Object segmentation over electron microscopy
H01 release · Lichtman Lab / Harvard & Connectomics at Google · CC BY 4.0
Shapson-Coe et al. (2024) · doi:10.1126/science.adk4858
Slide 2 of 20
Learning Objectives
- Explain why connectomics matters scientifically
- Formulate one testable connectomics question
- Distinguish motivating narratives from evidence-backed claims
- Identify personal learning goals for the technical track
Slide 3 of 20
Capability Target
Write one connectomics study question with measurable structural outputs and one explicit non-claim. Articulate a personal motivation statement linking daily annotation work to a larger scientific mission.
Slide 4 of 20
Concept Focus
1) Question before method
- Technical: define target measurement before tool choice.
- Plain language: know what you are asking first.
- Misconception guardrail: tools generate good questions automatically.
Figure description and teaching notes
Further teaching detail from the module:
**Technical:** define target measurement before tool choice. A well-formed connectomics question specifies the circuit, the organism, the resolution, and the expected structural readout (e.g., synapse count, path length, motif frequency). Tools like FlyWire or CAVE are powerful but directionless without a hypothesis.
Slide 5 of 20
Core Workflow
- Identify curiosity question.
- Convert to measurable structural hypothesis.
- Define one metric and one limitation.
- Plan first dataset/tool touchpoint.
Slide 6 of 20
Core Workflow (continued)
- Write a personal motivation statement connecting your question to a long-term scientific goal.
Slide 7 of 20
Run of Show (90 min)
- Block 1: Opening hook (00:00-12:00)
- Block 2: Connectomics landscape (12:00-28:00)
- Block 3: Question framing workshop (28:00-48:00)
- Block 4: Evidence-boundary critique (48:00-65:00)
Figure description and teaching notes
Block 1: Opening hook (00:00-12:00)
Instructor script: "Welcome. Today we answer one question: why would anyone spend years mapping brain wires? Let me show you." Play 3-minute clip from Sebastian Seung's TED talk. Then show a before/after of a raw EM image vs. a fully reconstructed neuron. Ask: "What questions could you answer with this reconstruction that you could not answer with the raw image?"
Collect 3-4 responses on whiteboard. Highlight that each response implies a different measurement.
Block 2: Connectomics landscape (12:00-28:00)
Instructor script: "Let's ground this in real projects." Walk through three case studies in 5 minutes each:
C. elegans (White et al., 1986): the first complete connectome. 302 neurons. What it enabled, what it could not explain.
FlyWire whole-brain (Dorkenwald et al., 2024): 130,000+ neurons, 287 proofreaders, first whole-brain connectome of an adult animal with complex behavior.
MouseConnects HI-MC (ongoing): scaling to the mouse hippocampus at 10 mm³, the challenge of petascale data.
After each case study, ask: "What question drove this project?" Write answers on board.
Block 3: Question framing workshop (28:00-48:00)
Instructor script: "Now it is your turn. Take 5 minutes to write down the broadest brain question you care about. Do not filter." (5 min silent writing)
"Now narrow: what specific circuit or region relates to your question? What structural measurement would you need?" (5 min revision)
Pair-share: partners critique each other's questions using the checklist: Does it specify organism? Region? Measurement? Limitation? (10 min)
Block 4: Evidence-boundary critique (48:00-65:00)
Instructor script: "Every good connectomics question has a twin: the non-claim. What can your structural data NOT tell you?" Present three example hypotheses and their non-claims. Learners practice writing non-claims for their own questions.
Class discussion: collect 3 examples of well-formed question + non-claim pairs.
Block 5: Motivation statement drafting (65:00-80:00)
Instructor script: "Before we close, I want you to write something personal. Why are you here? Not the resume version --- the real version. What about brains or circuits or data makes you want to do this work? And how will you remind yourself of that reason when the work gets tedious?"
Silent writing: 10 minutes. Prompt: "Write 3-5 sentences explaining why you want to work in connectomics and what you will do when motivation dips."
Voluntary sharing: 2-3 learners read their statements aloud.
Block 6: Exit ticket (80:00-90:00)
Submit: (1) your testable question with metric, dataset, and non-claim; (2) your motivation statement.
Instructor script: "These two documents are your compass for the rest of the program. We will revisit them in Module 06."
Slide 8 of 20
Run of Show (90 min) (continued)
- Block 5: Motivation statement drafting (65:00-80:00)
- Block 6: Exit ticket (80:00-90:00)
Slide 9 of 20
Misconceptions to Watch
- Misconception guardrail: tools generate good questions automatically.
- Misconception guardrail: a completed connectome is a full explanation of behavior.
- Misconception guardrail: broad vision statements are sufficient project plans.
- Misconception guardrail: excitement at the start is enough to carry you through a multi-month project.
Slide 10 of 20
Misconceptions to Watch (continued)
- Misconception guardrail: if the work feels tedious, you chose the wrong field.
- Misconception guardrail: good annotators never make errors.
- Misconception guardrail: my individual contribution is too small to matter.
Slide 11 of 20
Studio Activity
Scenario: Learners produce two artifacts: a question-to-hypothesis sheet and a personal motivation statement. Part A (30 minutes) builds the sheet, Part B (20 minutes) drafts the statement, and a 10-minute peer review closes the session.
Slide 12 of 20
Activity Output Checklist
- Evidence-linked artifact submitted.
- At least one limitation or uncertainty stated.
- Revision point captured from feedback.
Slide 13 of 20
Assessment Rubric
Minimum:
- Question names organism, region or circuit, and one structural measurement with units.
- Metric, dataset, and non-claim are all present and consistent with each other.
- Motivation statement addresses both why and how.
Slide 14 of 20
Assessment Rubric
Strong:
- Falsification condition names the specific result that would count against the hypothesis.
- Scope is sized so the first milestone could be finished within a week.
- Motivation statement names at least two sustainability strategies with triggers ("when X dips, I will Y").
Slide 15 of 20
Assessment Rubric (continued)
- Non-claim correctly identifies a functional inference the structural data cannot support.
Slide 16 of 20
Assessment Rubric
Failure:
- Motivational text without measurable outputs, or a question no result could contradict.
- Motivation statement is generic ("I like brains") or omits a plan for the motivation gap.
- Claim language exceeds the evidence class of the proposed measurement.
Slide 17 of 20
Exit Ticket
Write a 3-sentence hypothesis with one metric and one caveat. Then write 2 sentences explaining why this question matters to you personally.
Slide 18 of 20
References (Instructor)
- Use module references listed on the module page.
Slide 19 of 20
Teaching Materials
- Module page: /modules/module01/
- Session kit: /teaching/sessions/module01/
- Worksheet: /assets/worksheets/module01/module01-activity.md
Slide 20 of 20
Read, review, or teach
The reading version includes figure descriptions and discussion guidance.
Nanoscale text: CC BY 4.0. Scientific figures retain their individual credits.